Suzlon Energy Ltd. Technical Chart | 22-Dec-2011
Below is the technical chart of Suzlon Energy, listed on Indian stock market, with ichimoku Kinko Hyo indicator.
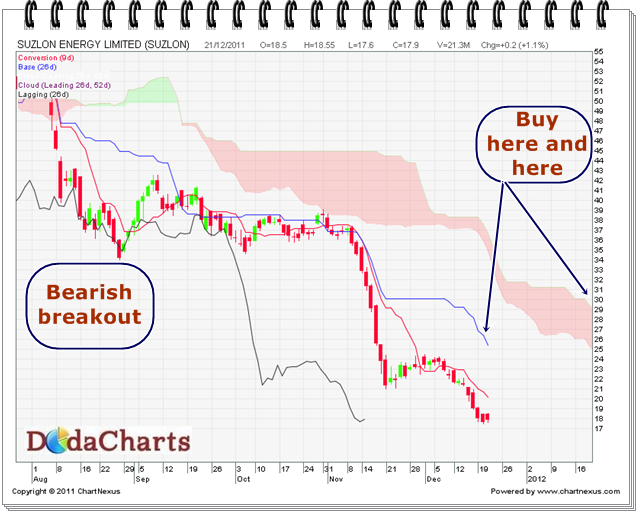
After giving the bearish breakout on 08-Aug-2011 @45.25, it is trading below kumo in southward direction. Yesterday, it closed at 17.90. Still, it is not the right time to invest in this stock. Wait for the price closing at least above kijun-sen line (blue line market above) for high-risk investors i.e. 25.46. To be more safe, wait for its closing above kumo i.e. above 29.38. Below these levels, it’s a sell on every rise and do short selling.