Suzlon Energy Technical chart | 22-Nov-2011
Below is the technical chart of Suzlon Energy, listed on Indian stock exchange, with ichimoku indicator.
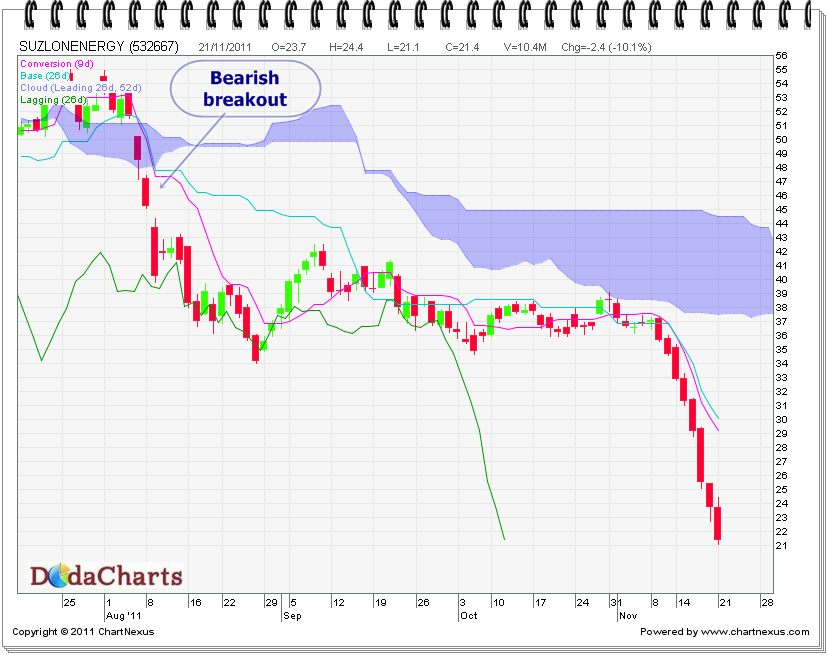
On 08-Aug-2011, Suzlon energy stock price CLOSED below kumo @45.30 and that was the first signal of its weakness. It was a strong bearish breakout. After that it started its downward journey and yesterday it closed at 21.40. After so much of downfall, small bounce back can not be ruled out. But that does not mean that one can buy this stock at these levels.
Even if you’re a short term trader, you should buy it when it closes above kijun-sen line viz. is currently at 30.07. For long term investors, take buy call when it CLOSES above 38.57.