Tata Consultancy Services (TCS) Technical Chart | 19-Dec-2011
 Below is the technical chart of Tata Consultancy Services (TCS), listed on Indian stock exchange, using Cihimoku Kinko Hyo indicator.
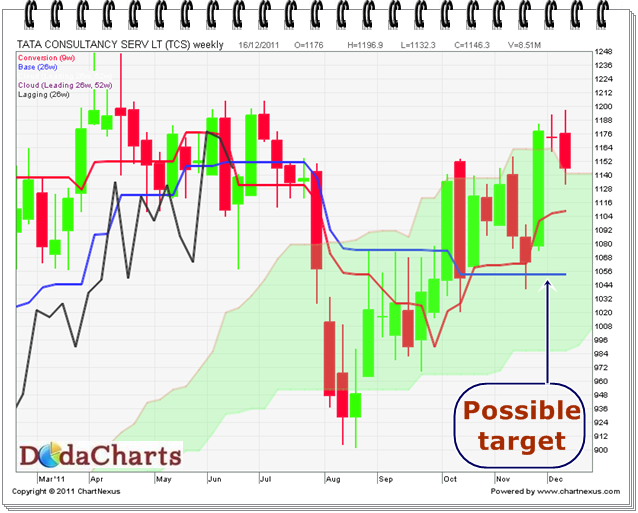
The price is trading above kumo on weekly chart, so one can surely say that the chart is strong and is in bull run. The only problem here is that on weekly chart, kijun-sen line is flat.
Whenever the kijun-sen line is flat, it will attract the price.
So, in coming days, the price of TCS can kiss the level of 1053.30. Watch this level carefully and take your positions accordingly.