Tata Motors Technical Chart | 17-Jan-2012
Below is the technical chart of Tata Motors, listed on Indian stock exchange, using Ichimoku Kinko Hyo indicator.
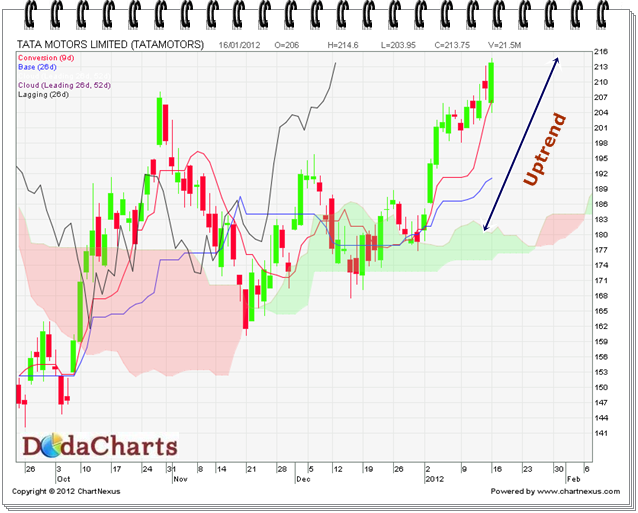
Ever since, Tata Motors closed above kumo @186.30, it is moving upward. Even now, there is sign of weakness here. In its weekly chart, it is trading inside kumo. So, it will face resistance @222.80 to 225. Major support is at 199. Take your positions accordingly.