Tata Steel Limited Technical Chart | 30-Nov-2011
Below is the technical chart of Tata Steel Ltd. with ichimoku Kinko Hyo indicator.
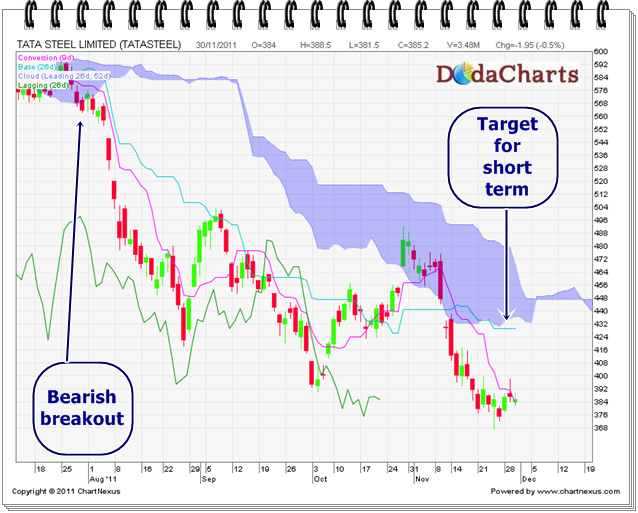
After giving bearish breakout @564 on 29-Jul-2011, it started moving downward. tried to cross kumo on Oct end, but failed.
Now, if you chart carefully, the price is moving downward, but kijun-sen line is flat. That means, it will attract the price in short term. So, immediate target for Tata steel is 429.60.