Tata Steel Technical Chart on Ichimoku | 19-Nov-2011
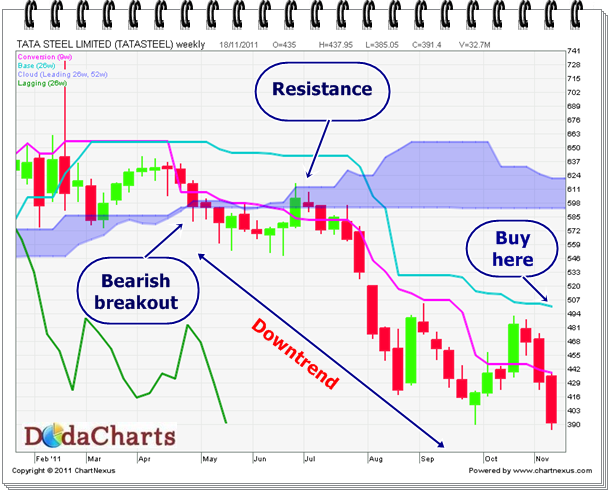
 Below is the technical chart of Tata Steel, listed on Indian stock exchange, with Ichimoku Kinko Hyo indicator. I’ve used weekly time frame here.
.png)
On 25-Feb-2011, Tata steel closed below kijun-sen line, at 606.85. That was the first signal of its weakness and opportunity to exit from long positions. For next weeks, it managed to get support on kumo , but traded below kijun-sen line. Then on week ended on 20-May-2011, it CLOSES below kumo and that was strong bearish breakout. It tried to cross kumo later on, but failed; and from there it started its downward journey. Yesterday, it closed at 391.40. Still, there is not even a single positive sign to take long position here.
One should buy this stock, if it manages to CLOSE above kijun-sen line, at least. And that level is currently @501.50 . Please note that this figure will change in coming weeks and you should take kijun-sen line in account and NOT this figure.