Technical analysis of EURUSD Weekly Chart
EIRUSD is range bound from the last so many days, not giving any clear signal. Let’s look out why and when will it give clear signal.
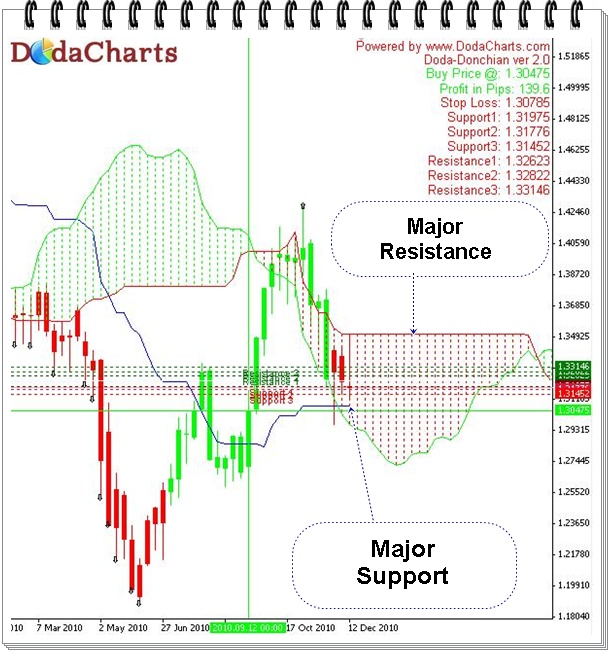
This is weekly chart of EURUSD with Doda-Donchian indicator. I’ve added Kumo of Ichimoku indicator also. For those who are new to Ichimoku, this is one of the best Japanese indicator, you can have. I’m fan of its Kumo lines.
If the price is above kumo, the chart is in bullish phase.
If the price is below kumo, the chart is in bearish phase.
and if the price is inside kumo, the chart is range-bound.
Right now, on weekly chart, EURUSD is inside kumo. That’s why you see range-bound movement of its price. Till it does not get out of kumo, you will not witness any clear trend.
On the upside, it’s major resistance is @1.3510 and on the downside, its major support is at Doda-Donchian line @1.3079 and then @1.2785. Closing on either side above/below will start another trend.
Till then, it will move here and there. So, don’t forget to mark your stop-loss.