The Rate of Change (ROC) Technical Indicator
Introduction to The Rate of Change (ROC)
The rate of change (Rate of the Change – ROC) – one of the most simple and very effective oscillators, which shows the percentage change in prices from one period to another.
The Rate of Change indicator is calculated as a comparison of the current price with the price of the previous period, which is spaced from the current one by N periods. The periods of the ROC indicator as always can be intervals from a minute to a month.
Formula of the The Rate of Change (ROC):
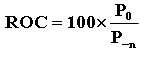
Where P0 is the closing price of the current period;
Where Pn – the closing price today N periods ago;
Note: in modern textbooks there is a disagreement about the Rate of Change formulas . The above formula is taken from Murphy’s “Technical Analysis of Futures Markets.” S. 305.
However, there is another variation in the ROC calculation from the book Akelis. Technical analysis from A to Z.
Normal ROC
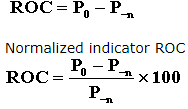
The latest version of the calculation is used in the Metastock and CQG software packages.
Next, we will describe the ROC calculated by Murphy’s formula.
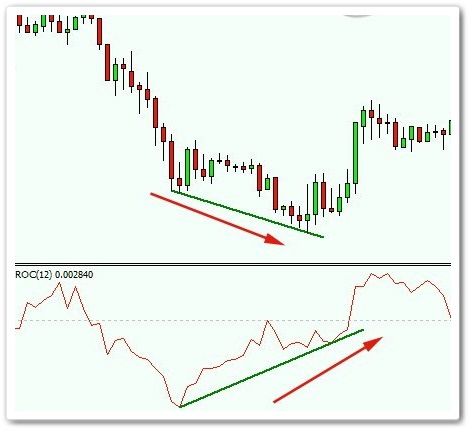
Sample chart with The Rate of Change (ROC) Technical Indicator:
Description of The Rate of Change (ROC) Technical Indicator
Rate of Change as the acceleration indicator allows you to track the smoothed rate of price change. The ROC oscillator graph oscillates above and below the level of a unit (or level 100, depending on whether it is 100% multiplied or not), thereby showing how the acceleration of the price changes, whether it is positive or negative. As a rule, the ROC indicator is slightly ahead of the main price trend and reaches a maximum or minimum earlier than the price does.
Crossing with the ROC indicator level 1 (or 100) and its further growth means an acceleration in the rate of price growth and an increase in the probability of its continuation. Turning the indicator on high levels from the top down means that the trend continues, but it is not gaining momentum, but begins to slow down gradually.
The fall of the ROC indicator above line 1 (or 100) means that the current trend of rising prices slows down the speed.
Crossing from top to bottom units and continuing the fall means accelerating the downward price movement.
A turn at levels below one means a slowdown in prices and a high probability of a reversal of the trend upwards.
The growth of the ROC indicator below line 1 means the attenuation of the downward trend.
It is considered that Rate of Change measures the level of optimism or pessimism of the crowd with respect to this asset, if the indicator grows, remaining above unity, this means that there is a new wave of optimism in the market, if a new low appears in the zone below unity, this means that a new wave pessimism in the market increases the likelihood of further price fall.
If prices continue to rise, making the chart a new high above the previous one, while ROC is growing but its new maximum is lower than the previous one, this means that a divergence in the indicator and price indicators has appeared, and one should prepare for a possible drop in prices.
In the opposite case, if the chart prices make a new low below the previous one, but on the graph indicator appears a new low, but higher than the previous, it is necessary to prepare for a market turn upward.
Thus, the slope of the indicator means the acceleration or slowdown of the trend, and its position relative to the level of unity – what is this trend – a fall or growth.
How to use The Rate of Change (ROC) Technical Indicator?
For the most part, the ROC indicator is used simultaneously with other techniques that support its signals.
The ROC indicator can be used in two main types of strategies : trend following and countertrend:
- When the ROC is used as a trend following indicator , it delivers trend signals when crossing the line of a unit (or line 100). When the line of the unit crosses from the bottom up, a buy signal is given, at the intersection from the top down, a sell signal is given. The number of signals and their accuracy in this case will depend on the main parameter of the indicator. As with other indicators, the shorter the ROC , the faster it reacts to price changes, or in other words, it is more sensitive and, accordingly, gives more false signals. The larger the ROC parameter, the greater the accuracy of its signals, but the longer their delay. Sometimes using short- term ROC indicatorsas a signal to enter the market, the intersection of the unit line is not used, but the intersection of certain levels above the unit line for the buy signal and the intersection of the levels under the unit for the sell signal. Thus, ROC movements within a certain range close to zero are not perceived as signals.
- Due to the fact that the main function of the ROC indicator is to measure the speed of the market, it can be effectively used as a countertrend indicator. Signals in this case come when the indicator is turned as high as possible above unity and as low as possible. A turn above a unit from the top down indicates a possible end of the upward movement and gives a sell signal. A turn far below the unit from the bottom up gives a buy signal. To determine the pivot points, you can also use oversold overbought lines, which are drawn on the chart of the indicator at certain levels. Overbought and oversold levels are selected in such a way that the indicator is in them about 10 percent of the total time.
- Breaks of trend lines on the indicator itself are often ahead of breaks in trend lines on the price chart. These breakthroughs can also be used as signals to enter and exit the market.
Disadvantages of The Rate of Change (ROC) Technical Indicator
Rate of Change as a simple moving average reacts to the price twice: when the price appears for the first time in the numerator, i.e. P0 and when the price appears in the denominator PN.
There are variations of the ROC indicator , for example, a smoothed ROC, which compares not the price of the current period with the price several periods ago, but the current value of the exponential moving average with its value several periods ago. This indicator does not have the above disadvantage, it provides rarer, but better signals.