Titan Industries Ltd. | 23-Dec-2011
Here is a technical chart of Titan Industries Ltd., listed on Indian stock exchange, using Ichimoku Kinko Hyo indicator.
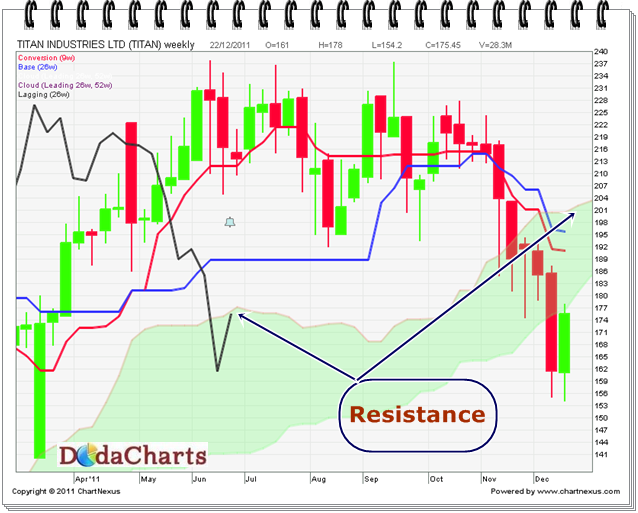
Titan industries Ltd. stock has given some rally in last 1 week time. But on weekly chart, it is about to enter high resistance area of Kumo. This range is from 178-204. Chikou-Span (CS) line is also touching kumo. I suggest to buy this stock ONLY when it closes above 204. 189 will be the immediate resistance now.