Titan Industries technical chart | 01-Nov-2011
Here is a technical chart of Titan industries, listed on Indian Stock market, with Ichimoku Kinko Hyo indicator. This is one of the famous and most successful indicator in technical analysis. You can read more it in tutorials section.
.jpg)
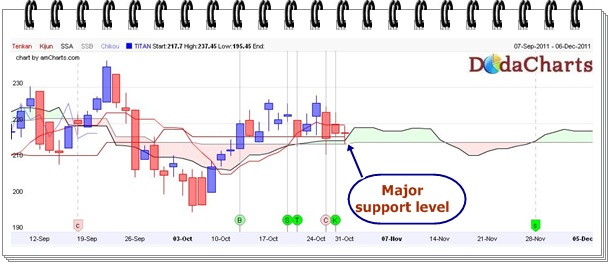
As it is clearly visible from the above chart, the price is taking support on kumo from the last few trading sessions. This level is at Rs.214.60. So if the price breaks this level, you SHOULD exit from the stock as then it will move downward. On the other hand, one can take long position here, if it CLOSES above Rs.221.
The chart is in very BULLISH mode in weekly as well as on monthly time period also. Good bet for long term investors.