Training of the main functions of MetaTrader 4
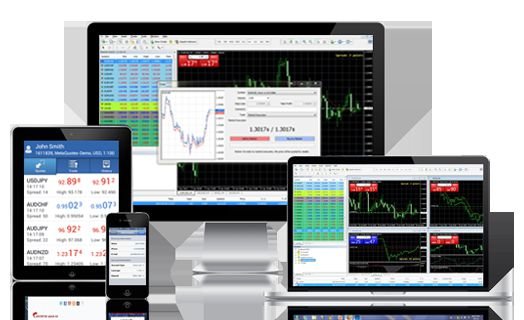
The trading terminal MetaTrader 4 is the main working tool of the trader. It allows you to trade in Forex markets, CFDs for metals, indices, commodities, cryptocurrencies, futures (depending on the broker and the specification for connecting your account).
With the help of the terminal, you can not only conduct trading operations, but also conduct market analysis, use automated trading programs, monitor the most important news, test your own trading strategies, and receive trading reports.
Despite the simplicity of MetaTrader 4, learning the basic functions of the trading terminal can take some time. Below is a description of the most common functions and operations in the terminal.
To start working with MetaTrader 4, learning its basic functions, you need to open a demo account, and to work with an existing account – connect it to the terminal.
You can do this by selecting “File – Open Account” or “File – Connect to Merchant Account” in the menu.
The terminal consists of several main working windows (sections):
- Market Review
- Navigator
- Data window
- Working area (graph display)
- Terminal
Quickly manage the working windows from the toolbar.

All windows are configured both in width and height. They can be completely closed and opened at any time.
In the MetaTrader 4 terminal, training is necessary first of all for mastering the basic functions of displaying charts, analyzing price movements, selecting tools and trading itself. The rest of the functions are used after understanding the basic ones.
The most commonly used tools can be divided into 5 groups (see the figure above).
Group 1.

Displays the type of graph. Most often when displaying charts, Japanese candles are used. However, in some cases or because of the habit, traders use a bar chart or display prices in the form of lines.
Group 2.
Scale the graph (![]() ). It is important from the point of view of visual representation of trends or specific details of price movement. Too large scale does not allow to see the general picture, but too small – will not allow to see the current situation on a given time interval. Choose the optimal scale.
). It is important from the point of view of visual representation of trends or specific details of price movement. Too large scale does not allow to see the general picture, but too small – will not allow to see the current situation on a given time interval. Choose the optimal scale.
Group 3.
Tracking for current prices (![]() ). The auto-scrolling function is extremely useful if you follow the latest current prices. But when analyzing the prices of past periods (to the left of current prices), it’s best to turn it off temporarily. The shift of the graph to the end allows you to instantly see the latest quotes.
). The auto-scrolling function is extremely useful if you follow the latest current prices. But when analyzing the prices of past periods (to the left of current prices), it’s best to turn it off temporarily. The shift of the graph to the end allows you to instantly see the latest quotes.
Group 4.
It is an analytical block (![]() ). Here you can build support and resistance lines, trend lines, price channels, Fibonacci lines, and measure price movements.
). Here you can build support and resistance lines, trend lines, price channels, Fibonacci lines, and measure price movements.
Group 5.
Time ranges for displaying the graph, or timeframes (![]()
![]() ). Here you can set the time period for displaying the graph (from 1 minute to 1 month). The selected period will be displayed with a single candle, bar or dot on the chart.
). Here you can set the time period for displaying the graph (from 1 minute to 1 month). The selected period will be displayed with a single candle, bar or dot on the chart.
The display tools also include chart templates (the “Charts – Template” menu). Templates are responsible for displaying the graphs, for example, a convenient color scheme. They also allow you to save all the analytical constructs for a particular tool. All templates are stored locally, so downloading them again will only work on the computer where you created them.
To analyze the price movement, you can use various indicators (the menu “Insert – Indicators”). One of the most popular indicators are moving averages (Moving Average).
The selected area is the working area for plotting. By default, 4 graphs are displayed. However, you can configure any number of graphs, including several graphs on the same instrument. This is useful when working on different strategies with the same tool.
Add a new schedule can be from the menu item “File – New Schedule”. You can change graphics by dragging the desired tool from the “Market Watch” window to the workspace with the left mouse button pressed. You can change the size of windows at your discretion or organize them in the Window menu.
Working windows
The “Market Watch” window provides a quick understanding of the quotations of various instruments, as well as the size of the commission (spread) charged at the opening of the transaction.
The Navigator window allows you to switch between accounts, and also get quick access to indicators, advisers and scripts.
The data window provides brief information on the instrument, including opening prices, closing prices, maximums and minimums of the price, the number of contracts at the selected point. These data are also duplicated in the status bar at the bottom of the MetaTrader 4 window.
The terminal window (below) gives you access to your trading operations, account history, market news, buying robots and scripts, and terminal connections to the server.
Sometimes it’s important to pay attention to the connection state (). The numbers in this window should change constantly, and the green-blue bars indicate the presence of the connection. Short-term connection ruptures are possible. But if red lines with “No connection” are displayed in the window, you need to check the connection to the Internet or restart the terminal.
Transaction execution
To complete the transaction, you must select the instrument by clicking and click in the top toolbar “New order” or the F9 key. Under certain conditions, you can make a transaction in one click from the chart window.
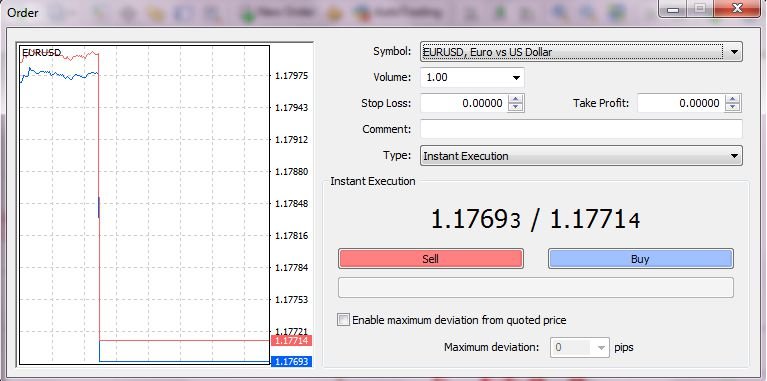
The Sell and Buy buttons allow you to place an order (order) for the broker to sell or purchase the relevant instrument. Volume is the number of contracts or parts that you conclude. Important items are Stop Loss (S / L) and Take Profit (T / P), when the values reach which your transaction will automatically be closed either with a planned loss in the first case, or with a planned profit in the second. When setting the S / L and T / P levels, you should pay attention to the spread and the current price, the changes of which may not allow you to set levels closer than the indicated spread. S / L will allow you to stop losses in time if the price goes the other way, and T / P – to fix the profit, if everything was in accordance with your expectations.
Detailed information about the operation of the Metatrader 4 terminal can be obtained in the terminal itself, by calling the help window with the F1 key.