Understanding Relative Strength Index RSI
Introduction to Relative Strength Index
The indicator was developed by J. Wallace Wilder. For the first time, the Relative Strength Index was introduced in June 1978 in the journal Commodities (now known as Futures), and then published in his book “New concepts in technical trading systems” and has since become one of the most popular oscillators assessing the strength of the movement. The Relative Strength Index compares the value of recent asset price rises with the magnitude of its falls and provides this information in the form of a number ranging from 0 to 100. The only parameter of the relative strength index is the time period used in the calculation.
Note: Be careful, since the name Relative Strength is quite common in various types of technical market analysis , for example, John Murphy’s Relative Strength analysis or indicators that show the relative strength of various securities in the stock market. It must be remembered that the Relative Strength Index is calculated based on the price of one asset.
Formula of Relative Strength Index
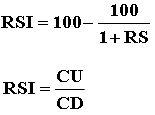
where
CU (n) – the average value of positive changes in the closing price;
CD (n) – the average value of negative changes in the closing price;
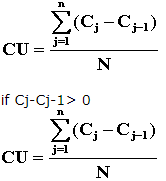
if Cj-Cj-1 <0
The author himself recommends 14 periods as the main parameter.
It should be noted that for the RSI period of 14, the average value of positive closing price changes (and the average value of negative closing price changes) is divided by 14, even if these positive (or negative) deviations themselves are 5.
Average value of positive closing price changes and average the value of negative changes in the closing price are not real moving averages. Instead of dividing by the number of positive and negative changes, both indicators in the denominator have a total number of periods for calculating the RSI.
Sample Chart with Relative Strength Index Indicator
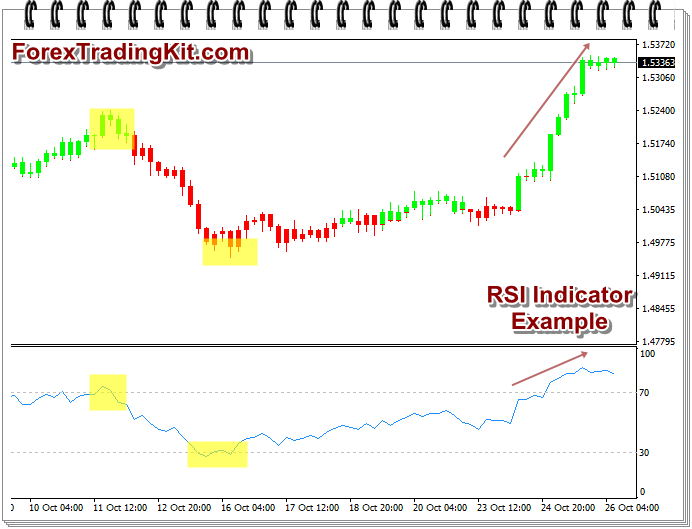
Description of Relative Strength Index Indicator
When the average value of positive closing price changes is greater than the average value of negative changes in the closing price of the RSI, the value of RS is increasing, since the value of RS is greater than one, respectively, when the average value of positive changes in the closing price is less than the average value of negative changes in the closing price of the RSI falls, since RS is less than unity.
As with most oscillators, the more data is used to calculate RSI (the longer the RSI period), the more accurate the results will be. In most cases, for the RSI market analysis, a typical overbought and oversold zone method is used. The author (Wilder) recommends using for zones overbought and oversold zones correspondingly above 70 and below 30. The zone above 70 thus by the author shows that the market is overbought (ie further upward movement will soon exhaust itself), and the zone below 30 is considered oversold zone(ie further downward movement will soon exhaust itself). However, there are many other variations regarding the ratio of these levels: 75/25 or 80/20.
In the Forex market, the last level ratio is often used. As the central, usually consider the level of 50.
The Relative Strength Index is mainly used in markets that are in a sideways trend because in markets that are in a directed trend, it can be used only to determine entry and exit points within a trend.
The use of the Relative Strength Index as the main indicator in the trend market can lead to a large number of false signals.
How to use Relative Strength Index Indicator?
- As an advanced indicator without signals. Maxima behind level 70 and lows below 30 often outstrip the highs and lows on the price chart.
- Trend strategy: some traders perceive the intersection as an indicator on the trend market of point 50 upwards as an uptrend, and fall below 50 as a downtrend. Therefore, crossing level 50, when the market is a trend, in itself is a signal for entering the market. However, in the formation of an undirected lateral trend, such a strategy will give a lot of false signals, since RSI will often cross level 50.
- Countertrend strategy. Signal levels used are 70 and 30, 75 and 25, 80 and 20, or others. At the same time, the signal for sale is given when the RSI leaves the overbought zone. crosses the level of 70% down, and the buy signal is sent when the RSI is out of the oversold zone, i.e. crosses level 30 from the bottom up. However, this strategy works only in the non-trendy period of the market. In the trend period, the indicator will go into one of the zones (with an uptrend in overbought, with a descending oversold) and will feed in this zone a lot of false signals constantly crossing the line separating the zone.
- In Lebo’s book, Lucas “Computer analysis of futures markets” describes a way to deal with false RSI signals, which often occur in overbought and oversold zones. A sell signal appears if RSI forms a double vertex (a figure of the type // – the letter M) in the overbought zone (for example, over 70), with the second vertex lower than the first. The sell signal appears when the bottom of the double top is broken. Conversely, if the RSI creates in the oversold zone (for example below 30) a double base figure (figure of type // or W), where the second minimum is higher than the first, then the buy signal is given if RSI breaks the level of the average high up. It is believed that the higher in the overbought zone and the lower the oversold zone, the stronger the signal.
- Signal divergence. As with other oscillators, the divergence signal comes in the case of a discrepancy between the ratio of new highs or lows on the oscillator chart and the price. If on the oscillator chart the new maximum is lower than the previous one, and on the price chart the new maximum is higher than the previous one, there is a “discrepancy” between the oscillator and the price. This is a signal to sell. If the price makes a new low below the previous one, but an oscillator makes a new low above the previous one, this means that the relative strength of the downward trend. The decline is nearing, the turn is coming up and the signal for purchase comes. It is assumed that the distance between the minima and maxima on the oscillator should be from 7 to 50 periods, otherwise, the divergence will be too “raw” (if less than 7) or already “burnt out” (if more than 50).
- Graphic patterns. On the RSI chart, there often appear graphic patterns that traders use in analyzing price charts (such as head-shoulders, triangles, etc.).
- Support and resistance levels on the relative strength index graph often show more explicit levels of support and resistance than on the price chart itself.
Disadvantages of Relative Strength Index Indicator
It works poorly during the trend on the market (it gives many false signals).