Understanding Stochastic Oscillator
Introduction to Stochastic Oscillator
The Stochastic Oscillator was developed by George S. Lane. president of the corporation Investment Advantors, Inc. A stochastic oscillator is an indicator that shows the ratio of the current closing price to the maximum / minimum for a specified period.
Stochastic Oscillator Formula:
Stochastic is in most cases displayed on a graph in the form of two lines.
The most common and classic formula for calculating Stochastic is the following:

where max (Hn) is the maximum high for N-periods, min (Ln) is the minimum Low for N-periods, C0 is the closing price of the current period.

those. moving average with period M from% K
This version of the calculation of the indicator Stochastic is used in most technical analysis programs, including in the trading terminals DCTrader, Dealing Desk 2005.
However, there are several more variations known, for example, used in AFMCharts:

Where
– moving average with period N from the minimum price for the last 3 periods
– moving average with period N from the maximum price for the last 3 periods
In the future, within the framework of this section, we will only talk about the first Stochastic formula.
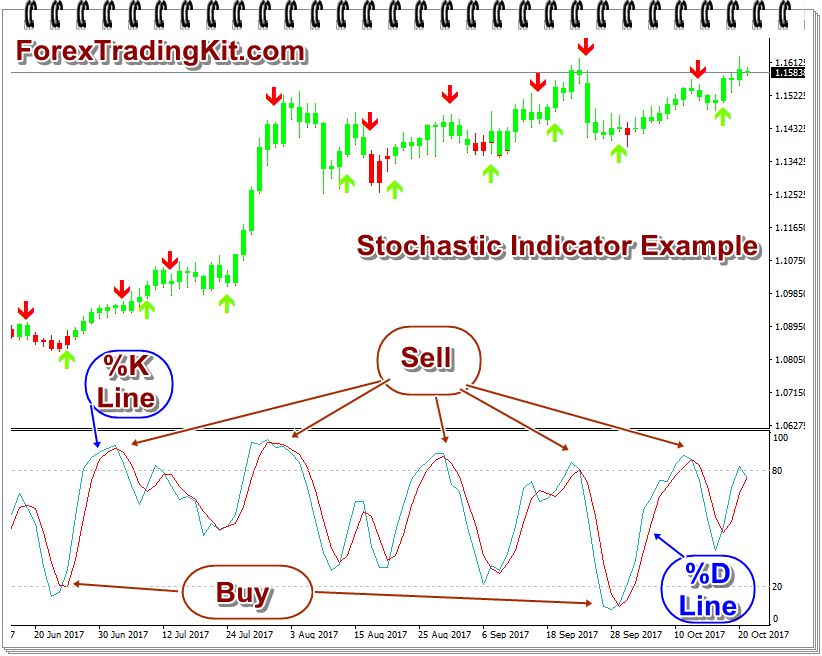
Stochastic Oscillator is displayed on the graph in the form of two lines: % K and% D.
Usually the first is drawn with a solid line, and the second is dashed.
Types of Stochastic oscillator
There are 3 types of Stochastic indicators: fast, slow and full.
Fast Stochastic Oscillator
A fast stochastic oscillator consists of% K and% D lines to exclude confusion later, we will call them% K-fast and% D-fast – this will mean that they belong to the fast Stochastic Oscillator. Accordingly,% K-slow and% D-slow will refer to a slow stochastic oscillator.
The main (the one from which the calculation begins) in all the above stochastic types is% K-fast, the formula of which is given above (classical %K).
Slow Stochastic Oscillator
%K-slow is defined as the moving average of %K -fast, usually with a period of 3. It is easy to see that% K-slow is identical to %D-fast if a sliding parameter equal to three was used to smooth the latter.
% D slow – there is a moving average of% K slow, too, usually with a period of 3.
Full Stochastic Oscillator
In the full Stochastic indicator, three parameters are used.
- As in the versions of fast and slow stochastics, the first parameter is the number of periods used to create the initial% K.
- The second parameter is the smoothing factor used in calculating the initial% K. Thus, another moving average is superimposed on the original% K.
- The third parameter of the Stochastic indicator is the number of periods used to create the% D.
A complete stochastic is more advanced and more flexible than slow or fast stochastics.
A complete stochastic is thus something between the fast and medium stochastics, and for some sets of parameters, it can also coincide with them. For example, a short stochastic with parameters (14, 3) will be equivalent to a complete stochastic with parameters (14, 1, 3), and a slow stochastic with parameters (12, 2) will coincide with a complete stochastic with parameters (12, 3, 2).
Thus, the output of one of the other is constructed according to the following rules:
- % K (fast) =% K, calculated by the above formula (classical formula)
- % D (fast) = simple moving average with period Y from% K (fast)
- % K (slow) = simple moving average with period 3 from% K (fast)
- % D (slow) = simple moving average with period Y from% K (slow)
- % K (full) = simple moving average with period Y from% K (fast)
- % D (full) = simple moving average with period Z from% K (full)
Description of Stochastic Oscillator
Stochastic Oscillator is designed to exploit one of the properties of market prices: when the market is rising, closing prices are usually closer to the upper boundary of the trading range for a certain time interval and vice versa, with a decline in the market, the closing price is usually closer to the lower boundary of the trading range for defined time interval.
Stochastic Oscillator measures the location of the closing price of the last period relative to the upper and lower bounds of the price change for a certain time interval (a certain number of periods).
If the last closing price is close to the upper limit of the price range for the period, the Stochastic indicator will be close to 100%, if to the lower end of the range, then the oscillator will be close to zero. The multiplication by 100 in the oscillator formula is used to convert the number series into a percentage series.
In general, the stochastic oscillator, like other types of oscillators, works well only on the non-trend segment of the market. One of the most common uses is the setting of control levels. George Lane recommends the use of levels 80 and 20. Thus, Stochastic Oscillator readings below 20 mean that the market is now in a phase of oversold, and the reading above 80 means that the market is in an overbought phase.
However, Lane himself did not claim that finding a Stochastic Oscillator above 80 is necessarily a sell signal, and below 20 is a buy signal. The asset can grow in price for a long time after the Stochastic Oscillator overcame the level 80 and consequently fell for a long time after it fell below level 20. Lane claimed that good signals come in when the oscillator leaves the overbought or oversold zone, e. From a zone above 80 downwards or from a zone below 20 upwards.
In addition, Stochastic indicators use the intersections of the stochastic lines themselves.
It is believed that the so-called slow stochastic modification (mentioned above), where the most volatile curve %K is further smoothed out, is more popular among traders since it gives more accurate signals.
Using the Stochastic indicator
Intersection signals.
Signals for buying and selling are formed at the intersection of the Stochastic % K and% D indicator lines . It is believed that this is the fastest type of signal, but this is also its main drawback – a huge number of false inputs into the market.
The signals come in the following way: buy if% K crosses% D from the bottom up and sells when% K crosses% D from top to bottom. Such a system is similar to the moving average crossing system (since% D is moving from% K).
Exit the overbought / oversold zone.
- A buy signal arrives when the Stochastic Oscillator falls below line 20, and then passes this line from bottom to top. A sell signal comes in when the Stochastic Oscillator rises above line 80, and then pierces this line down.
- Quite often, the stochastic signal at the output of the zones is filtered by the first type of signal, using them simultaneously. The buy signal comes in when Stochastic Oscillator falls below line 20, and then passes this line from bottom to top, while% K crosses% D from bottom to top. A sell signal comes in when Stochastic
Oscillator rises above line 80, and then pierces this line down, with% K crossing% D from top to bottom.
- There is another signal filter, which further reduces the number of false inputs by strategy.A buy signal comes in when Stochastic Oscillator falls below line 20 and then passes this line from the bottom up, with% K crossing% D from the bottom up only after% D is already moving up. A sell signal arrives when the Stochastic Oscillator rises above line 80, and then pierces this line down, with% K crossing the% D from the top down only after the% D is already moving down.
Thus, the last filter takes into account only the intersections to the right of the extremum (turning point), the rest are discarded (the% K curve must cross% D to the right of the% D turn). This filter in the literature is called right-sided crossover and is used not only on Stochastic Oscillator but also on other oscillators.
As the limitations of zones overbought and oversold are not only the levels of 20 and 80: in fact, it may be any other combination of levels, for example, 25 to 75 or 27 to 85. Often during the upward trend (the very direction of the trend determine other methods of analysis), the two-level shifted upward by several percents to obtain less false signals, and during a downward trend, both levels are shifted down.
Often these levels themselves are made floating depending on the current volatility or direction of the price movement.
Divergence in Stochastic Oscillator
One of the methods of using signals from a stochastic oscillator is to study its divergences (the oscillator readings and price differences) as well as in other oscillators. If prices make a new high on the chart, which is higher than the previous one, and Stochastic at this time makes a new high on its chart, but lower than the previous one, this means that a downward turn of the upward movement may begin soon. Conversely, if prices make a new low on the chart on the chart that is lower than the previous one, and the Stochastic indicator at this time makes a new low on its chart, but above the previous one, this means that a downward trend reversal may soon begin to reverse up.
Usually, the divergence is not used as an independent signal, but the penetration of overbought and oversold levels (lines 80 and 20) after divergence is formed, sometimes taking into account the intersection of% K and% D, corresponding to point 1 or 2, is used.
Disadvantages of Stochastic Oscillator
As in the case of other oscillators and the conventional moving average, the Stochastic Oscillator changes rapidly when entering new and very different prices from the main channel and when they exit the calculation. This behavior gives greater instability of results.
Stochastic Oscillator gives a lot of false signals inside the trend – it gives signals for an opening against the trend. Unfortunately, to determine in advance the trend will or not, and accordingly, to use stochastic signals or not, it is difficult or impossible at all. However, if it is still able to do something bad to use the Stochastic Oscillator to add to positions in the short-term pullbacks and to exit or partial closing of positions at the local maxima of the rising trend and local minima downward.
How to filter out false signal in Stochastic Indicator?
A better version of Stochastic indicator is available as Doda-Stochastic indicator, which filters out false signals and used by many professionals in Forex trading, commodity trading and stock market trading