USDCAD Technical Chart | 13-Dec-2011
Below is the technical chart of USDCAD with Doda-Doanchin and Doda-Bollinger Bands indicator.
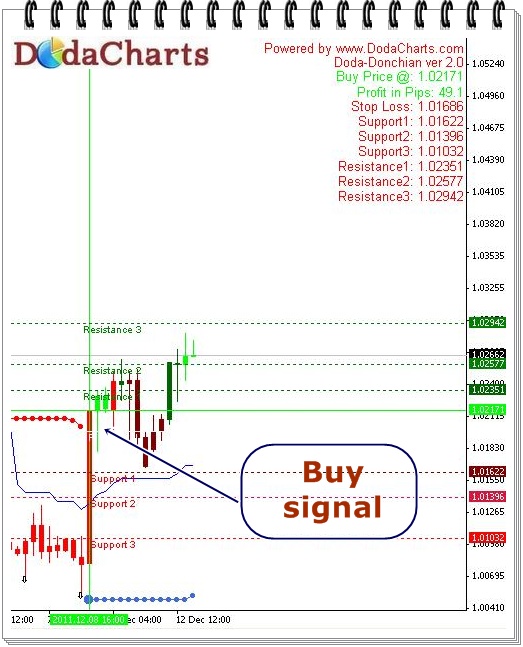
As expected, Doda-Donchian gave buy signal on this currency pair @1.02171. Doda-Bollinger Bands also confirmed the same signal. But if you look at the chart using ichimoku indicator, the price is trading inside kumo and one of the strong resistance level. The range is from 1.02706 to 1.0302. Once it manages to close above these figures, it will rise with great speed. The target will be 1.03756 and then 1.0475. On the downside, support is at 1.0224