USDJPY Technical chart | 25-June-2014
Today, we're going to analyze the technical chart of USDJPY currency pair. I've taken Japanese indicator Ichimoku along with our own built Doda-Donchian and Doda-Bollinger band indicators.
Time frame taken is H4.
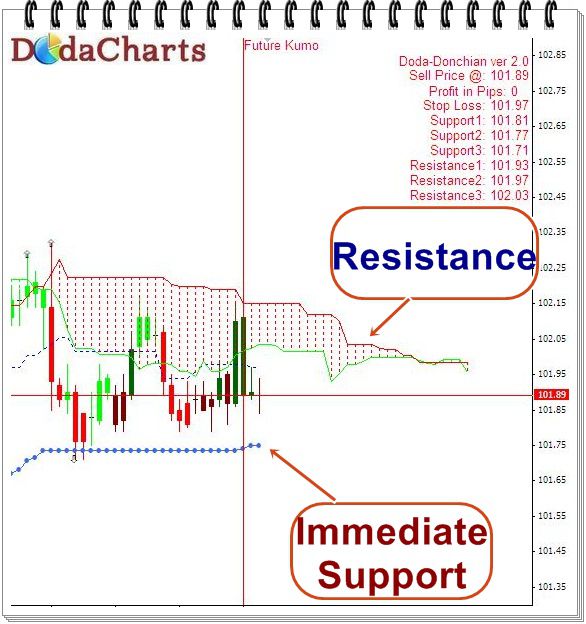
From the last many trading sessions, this currency pair is in range bound between around 101-102 - just few pips here and there. Whenever any currency pair or stock price moves in range bound, one thing is sure that it is preparing to breakout.
Now, we've to see in which direction that break out happens - on upside or on downside.
Looking for upside, it has a strong resistance of kumo - which is currently at 101.98. This level is also its weekly pivot point. That means, it must cross and close above this level to start fresh uptrend.
On the downside, 101.75 and 101.65 are 2 strong support levels. It must close below this level to start fresh downside.
I suggest you to do NOTHING now in this currency pair and wait for these levels to take action.
Major levels for this week:
Support @ : 101.65, 101.37, 101.04
Resistance @ : 102.26, 102.59, 102.87