What are Japanese candles?
This article explains Japanese Candles for Beginners. We’ll discuss their history, their types, and also a little bit into the analysis of Japanese candles.
Japanese candles are a universal type of charting, which displays not only the course of the price trend but also interval (one candle is a certain time interval (timeframe) during which the price moved). In other words, the Japanese candles show how the price moves on the time scale, but also the course of the price within a certain specific time interval (minute, 5, 15, 30 minutes, 1, 4 hours, 1 day, 1 week, 1 month, and sometimes even a year ). Most often, Japanese candles are used in the technical analysis of the market.
Japanese Candles
Where did this type of graphics come from, and why are Japanese candles called exactly?
It’s very simple, we’ll find the answer on the pages of history. Japanese candles originated in Japan (surprisingly, true?) Thanks to the Japanese rice market, which operated since the XVII century. The Japanese, long before the classical version of Charles Dow’s technical analysis, used candlestick charts to analyze the rice market. In the classical form, the analysis of Japanese candles, which we see now, formed already by the 1850s. A very great contribution to the analysis of Japanese candles was made by the famous Steve Neeson. It was he who opened the Japanese candles to the western world of trading, actively popularizing the analysis of Japanese candles for trading on stock exchanges.
Now let’s look at the appearance of the Japanese candle.
The Japanese candle consists of a “body” and “shadows” (less often a “tail”, a “wick”), and displays the price of opening and closing, as well as the price of the maximum and minimum for a specific period (timeframe).
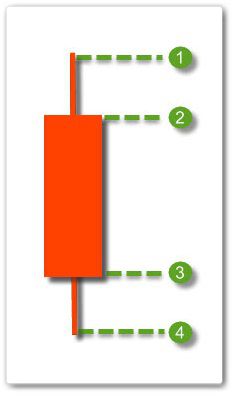
Classic Bearish Japanese Candle
In the picture, we see a classic look of a bearish Japanese candle
1. The price of the maximum (usually denoted by the Latin letter “H”, from English Height / High). It is at the highest point of the candle shadow. Displays the maximum price movement for a specific period.
2. The price of the opening (Latin the O”, from the English Open – to open). A mark that fixes the price at the beginning of the period of candle opening. It is the beginning of the body of the candle.
3. Closing price (Latin “C”, from English Close – close). A mark that fixes the price for the end of the candle closing period. It is the end of the body of the candle.
4. The price of the minimum (Latin “L”, from the English Low – bottom). It is at the lowest point of the candle shadow. Displays the minimum price movement for a specific period.
For a bullish candle, the “H” and “L” marks remain unchanged, and “O” and “C” change, respectively, in places (“O” at the bottom, “C” at the top).
During the movement of the market (that is, during the formation of the candle), a Japanese candle can change its status from a bearish to a bull several times, especially with strong market fluctuations.
If the price closes (“C”) is higher than the opening price (“O”), then this candle is called bullish, that is, growing. On the graphs, it is displayed either hollow, or white, or, traditionally, with cold colors (green, blue, and so on).
If the closing price (“C”) is lower than the opening price (“O”), then the candle is called a bearish, therefore, a falling candle. The graphs are always displayed in black, or, traditionally, in “hot” colors (red, orange, yellow).
Most traders prefer charts with Japanese candles, as they are easy to read and easy to read. Looking at the Japanese candles you can see a more complete and clear picture of the movement of the price chart.
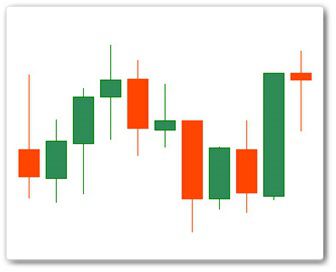
As you can see from the examples, Japanese candles come in different sizes. What is the reason for this? Let’s figure it out.
The longer the candle, the stronger the price increase in this period. If the body of the candle is long – this means that there is a strong pressure of sellers or buyers. If the body of the candle is short, this indicates a strong consolidation of prices and small growth.
So, the bullish Japanese candles (we are shown in green) signal about the greater pressure of the buyers of the asset. The longer such a candle, the stronger the price rises. But although such candles assume growth, one always needs to monitor their position on the chart. If, for example, after a long price drop, a long bullish candle appears, it can signal a potential trend reversal (especially if the candle has appeared at the support level). Too much pressure from buyers can trigger an intense bullish trend.
Bearish Japanese candles (we have – orange) signal a greater pressure of sellers. The principle of their action is the opposite of bullish candles. After a long growth, a long bearish candle may mean that in a short time, the trend may unfold, and indicate the level of resistance. After a prolonged drop in prices, a long bearish candle may indicate an even greater failure, and even panic in the market.
It is not uncommon to see such a type of Japanese candles on the chart as the ” Marubozu brothers “. These are candles and bearish and bullish, which do not have “shadows”, but only the body. These are very powerful candles that signal that in this segment only sellers or buyers dominated, respectively.
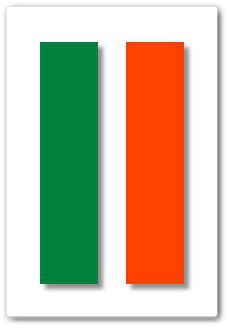
Japanese candles “Brothers Marubozu”
Shadows of candles
“What would your good do, if there was no evil, and what would the earth look like if shadows disappeared from it,” Voland said in the immortal novel of Bulgakov.
Almost at all candles, you can notice the lines above and below the body of a Japanese candle. These shadows can give very valuable information to someone who follows the market. The shadows of the candle are the range in which the price between the opening and closing of the candle went. In other words, the shadows of the Japanese candlestick reflect the struggle of buyers and sellers, and the closing price reflects what they came together in a particular period of time.
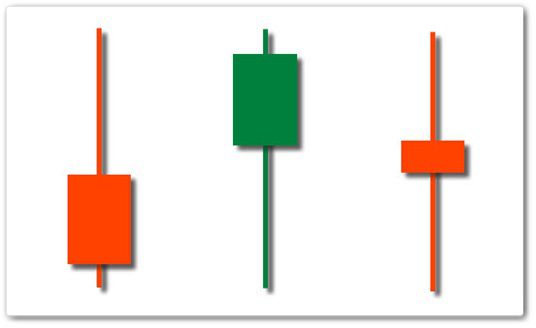
Shadows of candles
If you watch a candle that has a long upper shadow and a short lower one, it means that buyers tried to dominate during this period, offering a higher price for the asset. But, the sellers seized the initiative, and “knocked” the price down to what you see at the close.
If you see a short upper shadow and a long upper one, this illustrates the opposite situation. Here initially the sellers dominated but surrendered under the onslaught of buyers. It is these situations on the market that draw long shadows.
If the chart shows you a candle with long shadows and a small body, then you know: such candles are called “Volchok”. They symbolize indecision in the market. The big shadows indicate that both buyers and sellers have fought for a long time, but that’s why they did not come to anything. Such a Wolf after a long growth or a long bull candle means that buyers are weakened, and will soon surrender. The top after a long fall, can mean a weakening of sellers, and soon a trend reversal.
We’ll discuss different types of Japanese Candles like Hammer, Doji, Morning & Evening star and many more in the coming days.