When and how Gold started its bull run?
Gold is one of the commodity which has given decent returns regularly from the last several years. Even strong companies in stock market could not perform well in such a long period of time as they badly hurt investor portfolio during recession period of 2008.
Let’s see the monthly technical chart of Gold using our favorite indicators Doda-Donchian and Ichimoku.
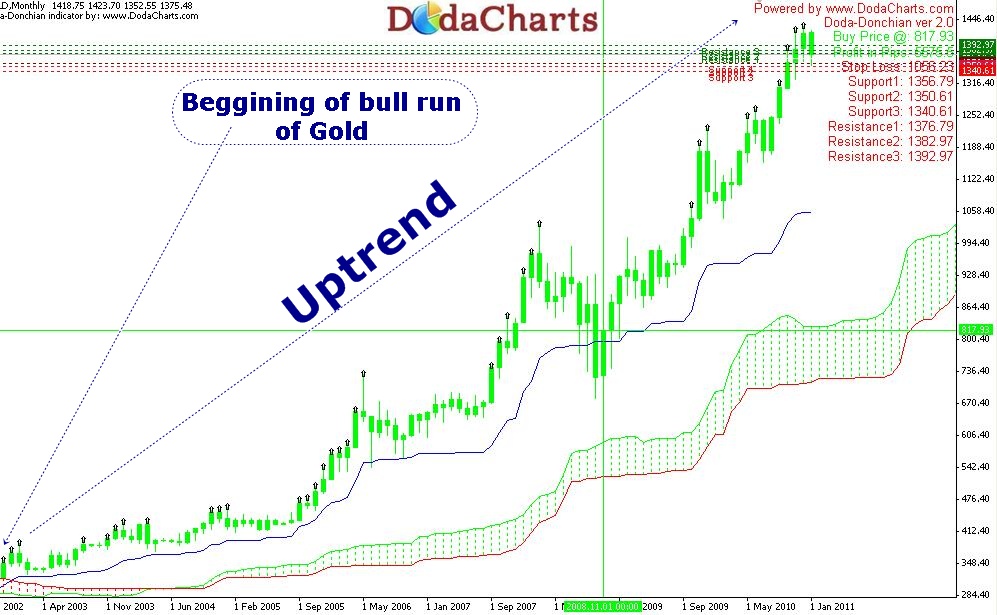
In the year 2002, Gold price closed above Doda-Donchian and Ichimoku Kumo (cloud); thus clearly giving the bullish kumo breakout and strong buy signal.
It continued its upward journey year after year, always getting support on Doda-Donchian line. Then, it gave some correction in year 2008, but could not even touch kumo and the chart remains intact. It again started its bull run in year 2008 itself and both Doda-Donchian and kumo are supporting it.
Gold may give correction any time but that correction should be used to buy more. It’s first support is at Doda-Donchian (blue line in chart) and next support is at kumo.