Why Sensex is rising?
Let’s analyze why Sensex is rising from the last 3 months. We’ll take the help of one of the best indicator & my own favorite one – Ichimoku.
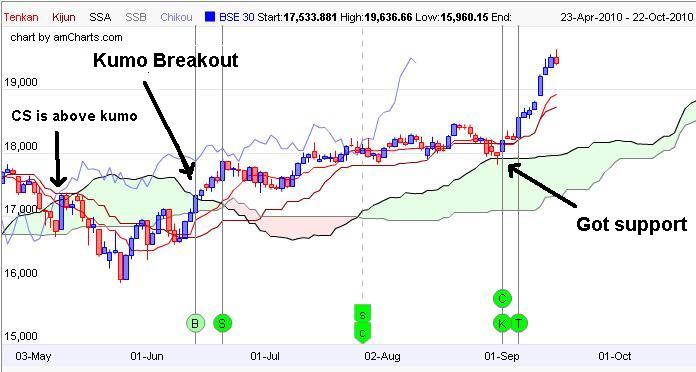
On 14th June 2010, at 17,338, sensex crossed the kumo and this is called "Kumo Breakout". At the same time, Chikou Span(CS) also crossed the kumo, thus confirming the same. So, the result – upward rally.
At the end of August, price started falling down. But Sensex got support on Kumo & on 1st Sept., 2010, price crosses Kijun Sen. Adding to it, on 6th Sept, Tenkan Sen crosses Kijun sen. And the rally is still on.
Till, price is above Kumo, it will continue to rise. The day it closes below kumo, one can exit long position & can take short position.