Yes Bank Technical Chart | 05-Dec-2011
Below is the technical chart of Dena Bank, listed on Indian stock exchange, using ichimoku Kinko Hyo indicator. I’ve sued its weekly time frame to get better view of its resistance and support area.
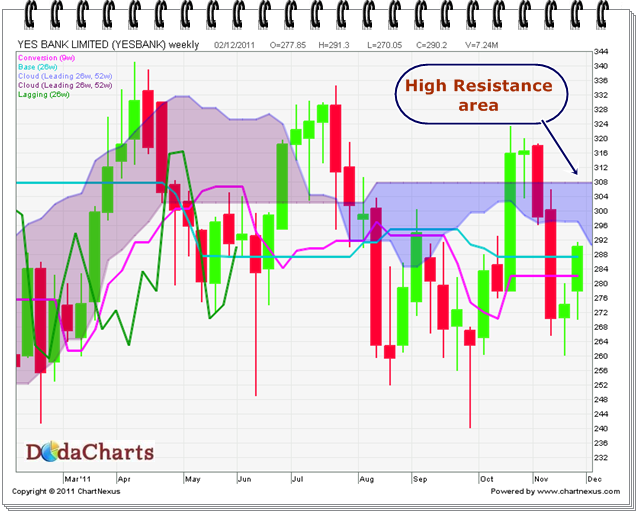
On a daily chart, Yes Bank will face tough resistance @292 and on weekly chart, resistance is till 308. So, use the current rally to book profit in Yes bank and wait till it CLOSES above kumo level viz. 308.
Once it closes above this level, you can safely buy this stock for the level of 334-340. But do not buy before that.